This article is part of a collection of 10 articles by Arnoldus Mateo van den Hurk Mir presenting a new system for to measure the impact of renewable energies in mining. You can find other articles on www.energyandmines.com . On the other hand, if you want the Spanish version can be directed to www.renewables4mining.com
Some years ago, the CEO of Volkswagen said: we do not measure the risk of operating in China; our concern is the opposite, the risk of not entering China. Today Volkswagen is the leader of the fastest growing automobile market in the world. At the time of entering “other unknown territories”, as non-conventional renewable energies (NCRE) for mining, we will follow a approach similar to that Volkswagen challenge.
More than measure the risk in using renewables for mining, why not we measure the risk of energy “Business As Usual” (BAU) concerning to the use of the fossil fuels for energy in mines. In doing so, we will propose a common metric system for both aspects, the Opportunity Risk concerning the exclusive use of conventional energy in mining and the Opportunity Cost that arise when avoiding the use of renewable energy for mining (R4M).
In this way the value proposition arises as:
The creation of Key Performance Indicators to figure out the opportunity risk in BAU Energy for Mining and the Opportunity Costs of NCRE for Mining
The Map for the R4M Territory
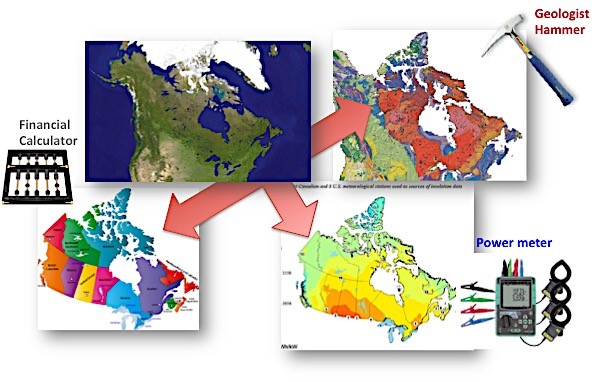
Decision Makers in Mining, EPC, energy facility developers and the investment community need new tools to measure risks and opportunities in the new territory of NCRE at the same time to conciliate a common language. As we can observe next figure this is a territory (the Canada’s aerial photography) with three different “maps and tools” in order to interpret the new territory of renewables for mining:
- Mining represented by the geological map of Canada using the hammer as main tool
- Electricity represented by the Canada’s solar energy resource map using a power meter as main tool
- Finance represented by the Canada’s political administrative map using the abacus as main tool
One territory, three maps. Maps aren’t territories; they’re only their representation. When using renewables in mining, miners prefer use tones or ounces as main unit; energy professionals prefer kWh or MWh and the financiers use USD or other money unit. These three points of view need for the same toolbox in looking for common key performance indicators (KPI).
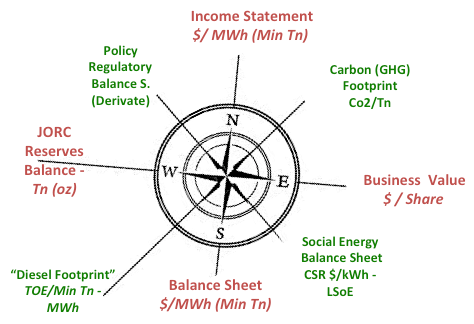
The Compass of R4M Territory
In addition to the map, to better understand the new territory, we will need a compass with eight key performance indicators as follows:
- Income Statement:
- Balance Sheet
- Business Value
- Reserve / Resource Balance (JORC Balance)
- Carbon Fooprint (Greenhouse Gases)
- TOE Footprint (or Diesel Footprint)
- Social Energy Balance Sheet
- Policy Regulatory Balance Sheet
Mapping the r4m KPI Territory
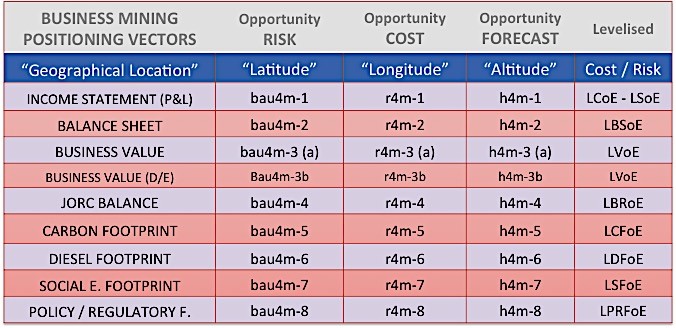
Therefore, the new mining positioning tool will work as a GPS comprising of three basic vectors:
- a “latitude” as the Opportunity Risk based on Business As Usual for mining component (bau4m)
- a longitude as Opportunity Cost based on Non Conventional Renewable Energy form mining component (r4m)
- and the “altitude” in level of hybridization between BAU and NCRE (h4m).
Finally combining the “map”, the “compass” and the “GPS” result of the new territory of renewables for mining will show the following Key Performance indicators.
Next table will show you the nomenclature of these KPI. The right column show the nomenclature used in Levelised terms. In this way bau4m, r4m and h4m will be measured with the same units (either kWh – MWh, Tones – ounces or USD – €) in terms Levelised Cost of Energy.
Over the next nine articles, we’ll explain each of these terms and how they apply in a practical way to case studies examples of copper mining in Chile.
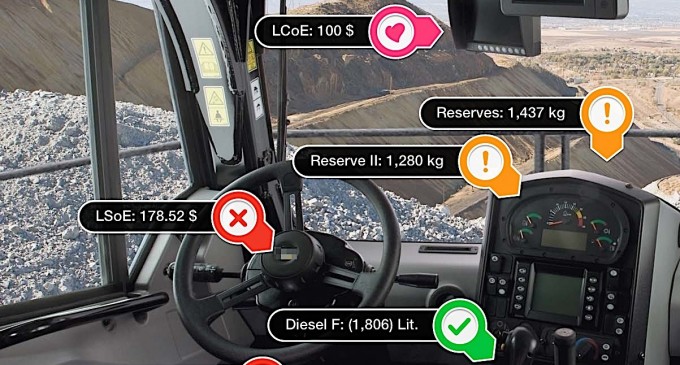
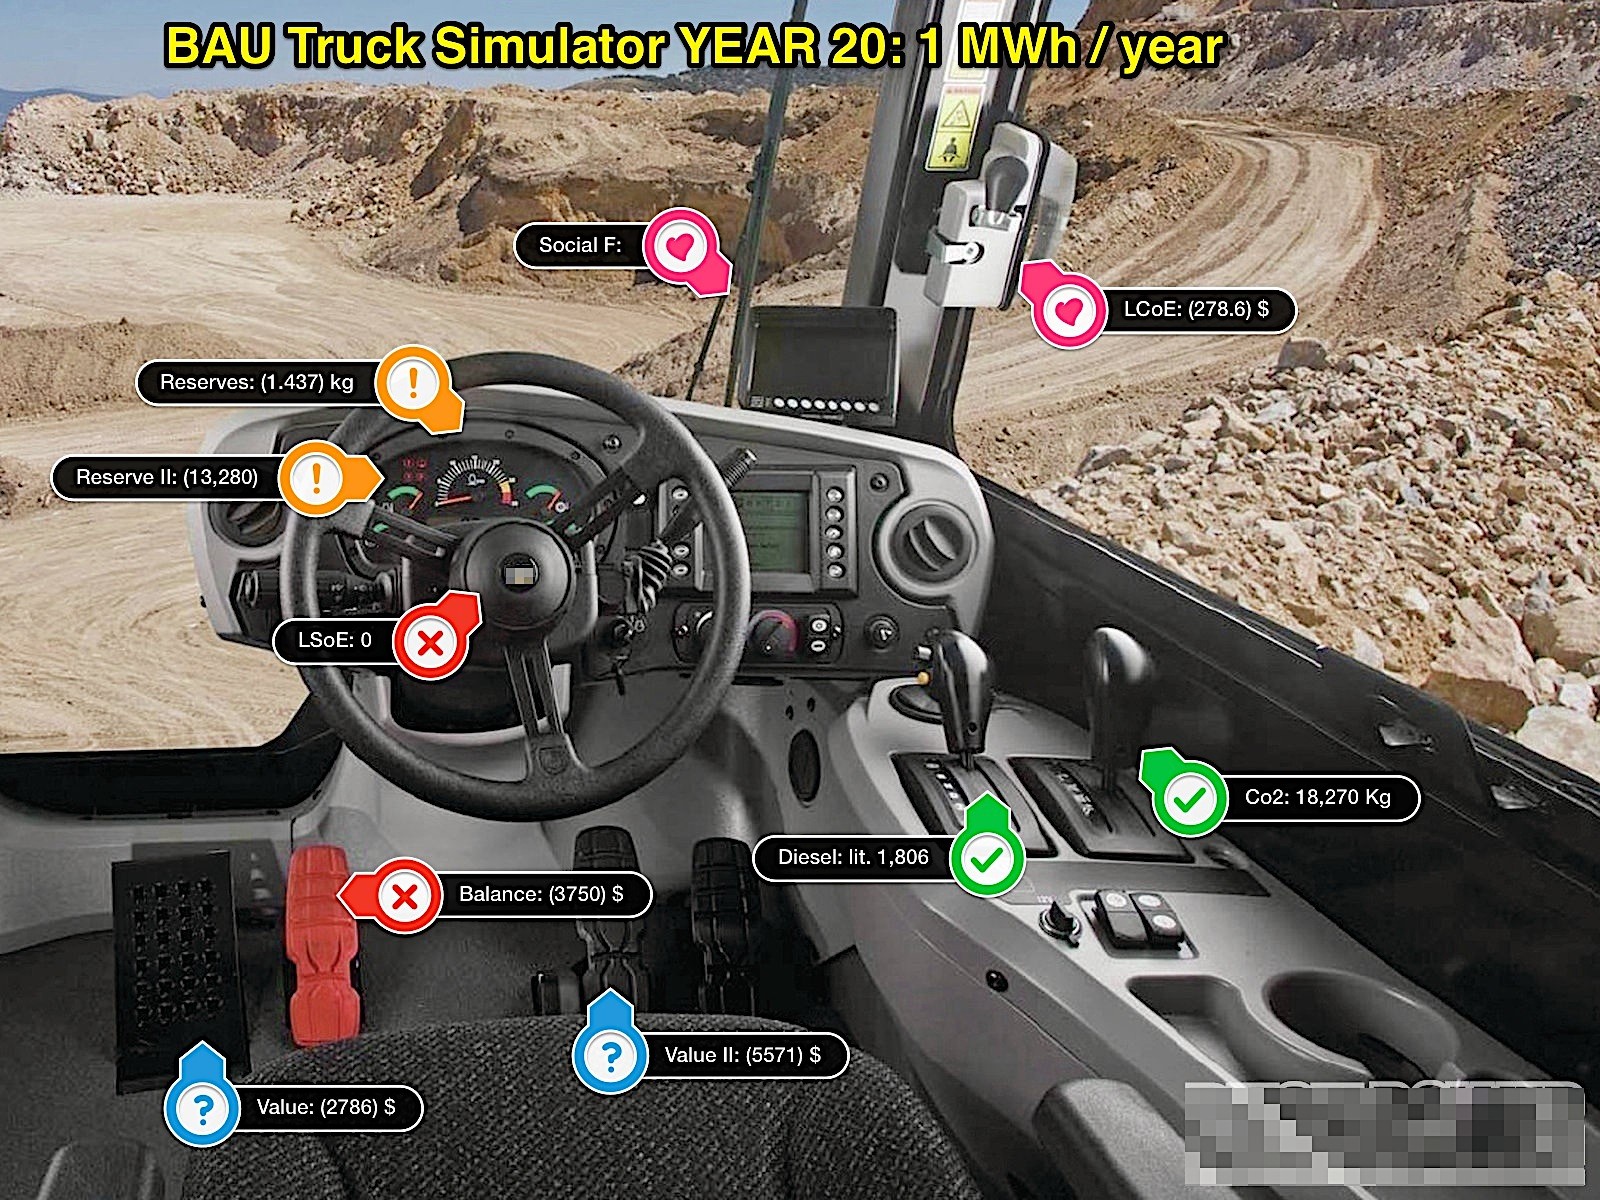
In order to present a preview of the ability of this methodology we present following a graph similar comparison using the dashboard of two mining trucks.
- First truck on the left shows the KPI in the operation of a mine with 100% renewable energy (r4m)
- Second truck on the right represents the same mine running on fossil fuels (bau4m).
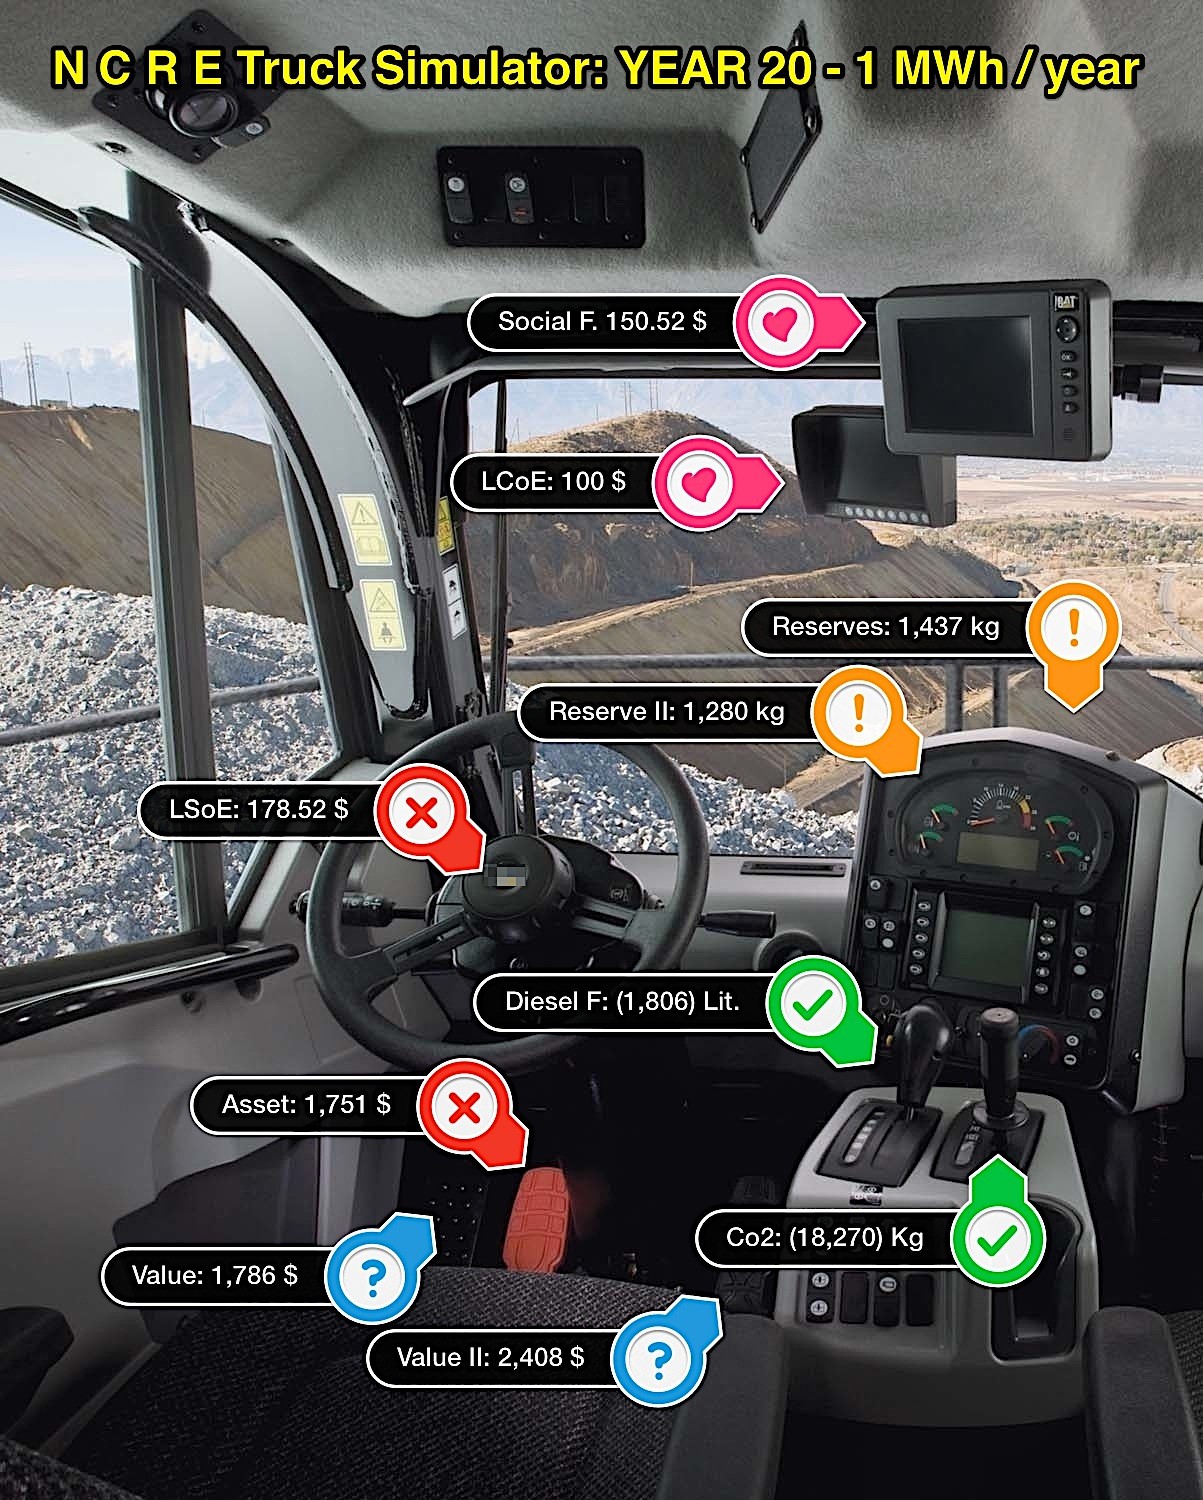
Income Statement, Balance Sheet and Business Value and others
We will explain some of the KPI relating to how it affects the power consumption of 1 MWh / year for 20 years in the mine. Which means to levelise for every MWh.
- INCOME STATEMENT:
- The r4m-1 mine saves 178.2 USD (Leverage Savings of Energy; LSoE).
- The bau4m-1 mine have no savings
- BALANCE SHEET:
- The r4m-2 mine has 1,751 USD in Assets.
- The bau4m-2 mine develops 3,750 USD in liabilities
- BUSINESS (mining) VALUATION:
- The r4m-3 mine increases value for 1,786 USD on average (20 years)
- The bau4m-3 mine decreases value for 2,786 USD on average (20 years)
- JORC BALANCE (reserves / resources)
- The r4m-4 mine transforms 1.43 Tn of Copper from resources to proven reserves thanks to savings
- The bau4m-4 mine, in the opposite way, transforms 1.43 Copper proven reserves into measured resources
- CARBON FOOTPRINT
- The r4m-5 mine saves 18.27 CO2 Tn
- The bau4m-5 mine develops a negative footprint (18.27 CO2 Tn)
- DIESEL FOOTPRINT
- The r4m-6 mine saves 1,806 liters of Diesel
- The bau4m-6 the opposite, 1,806 liters of Diesel