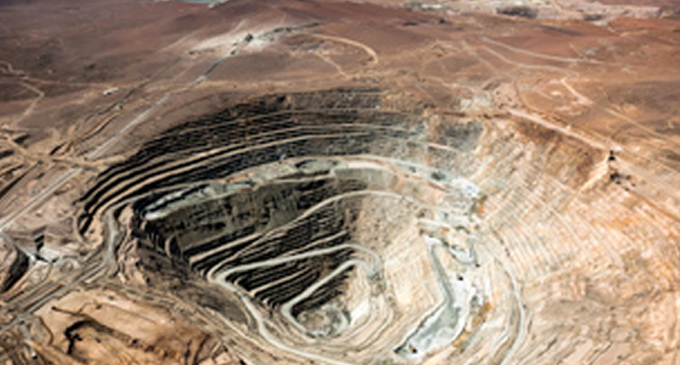
Doña Inés de Collahuasi is the world’s second largest copper mine. The mine is located at an altitude of 4,000 to 4,800m and is located approximately 200 km from sea. In 2011-12 the mine released another tender for Solar PV with a PPA for 60 GWh/year which was won by the Spanish developer SolarPack who developed the 23.5 MWac Almonte Solar plant. Collahuasi is carrying out a new private request for bids for 1,200 GWh of annual energy and approximately 150 megawatts of power, to be delivered starting in the year 2020.
Collahuasi will receive offers until November, and the winners will be revealed next year. The company is particularly interested in non- conventional renewable energy, which in Chile refers mainly to solar and wind power. Collahuasi produced 455,300 tons of copper in 2015 but the current mine is designed to produce an average of 500,000 tons a year. About 86% of this metal is copper concentrates and the rest are EW cathodes
The current grid price in the region offers around 88.44 USD/MWh.
The results of the simulations carried out by r4mining suggest the following possibilities
- A sale and lease back offering a levelized cost of energy of 17.5 USD/MWh is possible over a 25 year period starting from 2017. Financial collaterals would rely on very short terms escrowed mining assets.
- Some PPA financing solutions at different WACC offering a price range of 29.654 to 411.08 USD/MWh.
- A Joint Venture PPA (mine & IPP) delivering a price of 23.55 USD/MWh
The hybridized version with one-third solar PPA of 29.65 USD/MWh and two-thirds of grid at current price provides a 25 year price range of 64.99 USD/MWh.
There are two main parts of the simulation carried out by r4mining.
- The first, the solar PV model, provides developers with analysis and pricing for a solar PV RFP.
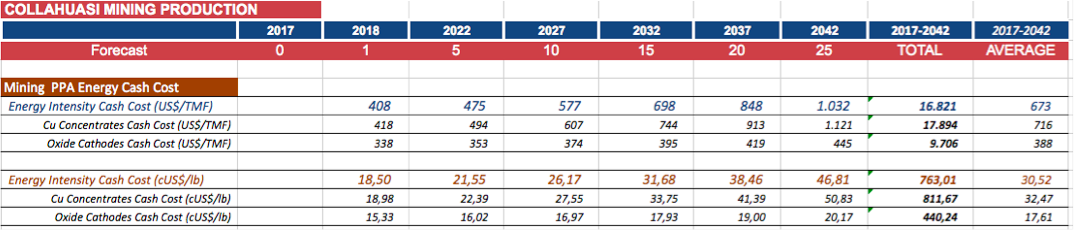
- The second, the mining power energy model, explores potential prices reflecting the change in mining power needs over the lifetime of the simulation due to: ore degradation, increase in mineral hardness, transportation distance and desalination and water pumping needs. These mine aging problems adversely affects the energy intensity (the energy demand per copper ton). In 2017 Collahuasi will need 4.6MWh for each ton. By 2042 (25 years) the mine will require 11.67 MWh per Ton.
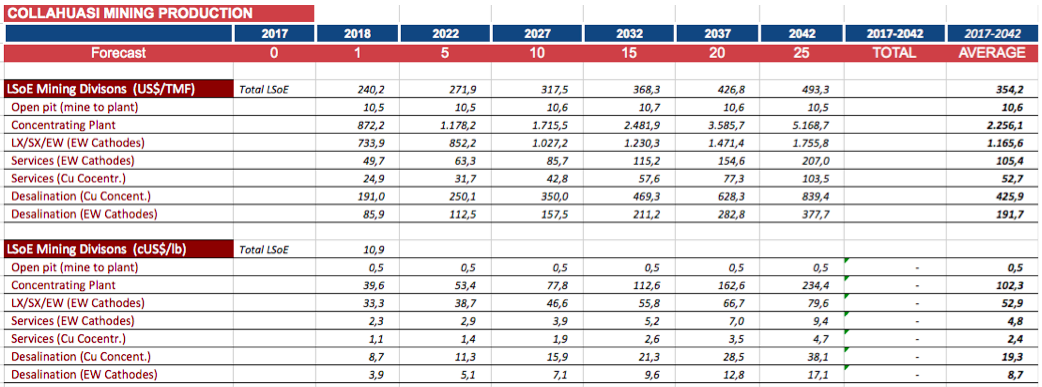
A third, more sophisticated simulation, has been developed that will enable energy providers and miners to estimate cost savings in terms of levelized saving of energy per ton savings for specific divisions within the mine e.g. concentrating plant, desalination plant, services, electro wiring, leaching. This final simulation will enable potential energy providers to provide an extremely detailed and useful analysis of the specific cost savings generated by using solar PV and specific parts of the copper production process. This business critical information is exactly in-line with the financial considerations all those within mine operations have to consider when making production and energy decisions.
Last but not least, the model developed shows the LVoE (Levelized Value of Energy) which considers the increase of value due to the savings transformed as EBITDA and divided by the WACC. This is an easy and fast way to evaluate a business used in other industrial sectors. It will strongly help the mining finance departments to link the production of solar energy with the value of company shares or per ton produced giving an excellent value add to mining shareholders and investors. This technique was published for first time in 2014 in the Canadian Industry Magazine (Financial Innovation on Renewables). The LVoE demonstrates that the increased value due to solar electricity savings surpass the capex upfront investment for the 150 MWac solar facility. Then, solar is FREE!
Some initial results are presented here. The full analysis will be presented as part of the pre-Congress workshop – An essential introduction to mining for renewables professionals on November 20th.
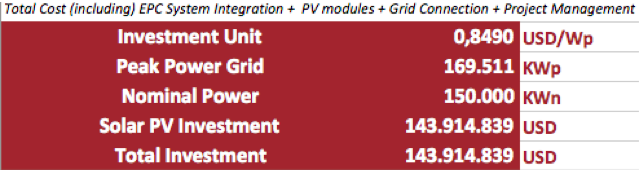
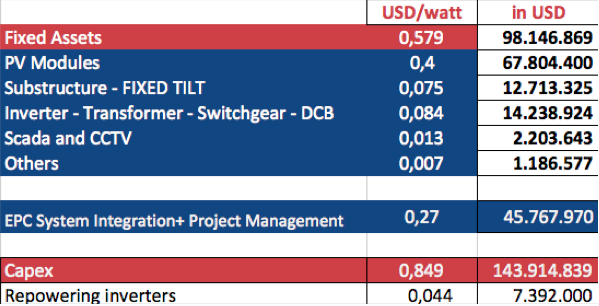
1.B. Capex Analysis Summary
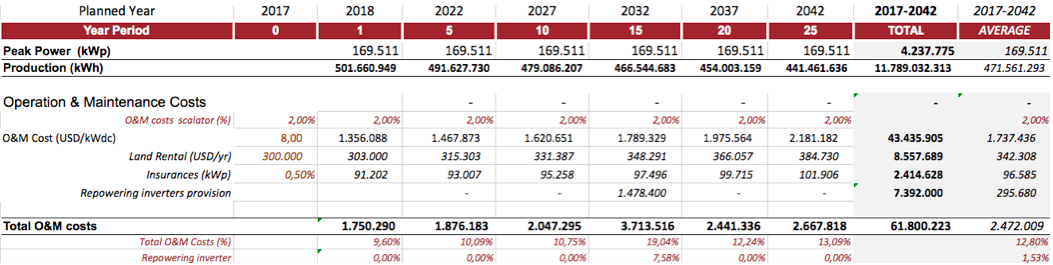
1.C. Opex Analysis Summary
1.D. Financial Costs Loan Analysis Summary

1.E. Investment Analysis Summary

Breakpoint: Year 2
Payback: year 6
1.F. Levelized Cost of Electricity Analysis Summary
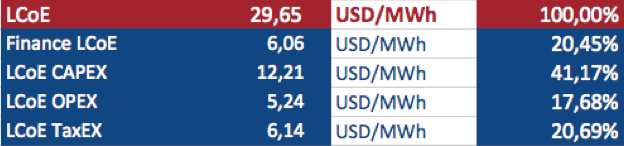
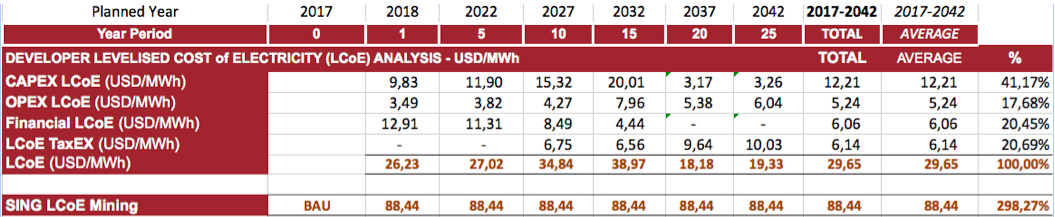
Year 26 the CAPEX LCoE = 0
LCoE Year 26 is 16 USD/MWh
1.G. Business Models Options

1.H. Valuation Plan and Exit Strategy

2. MINING ENERGY MODEL
2.A. Mineral Production Analysis

2.B. Copper Energy Demand

2.C. Energy Intensity Copper Production
The energy intensity for Chilean copper mining will increase by close to 300% over the next 25 years due to:
- The fall of mineral grade
- The increase in the hardness of the materials to be treated
- Increasing the distance between the mine and the process plant
- The needs in desalination and pumping of sea water up to the mine at almost 4000 meters in height

2.D. Energy Total Consumption and Solar PV Share

2.E. Energy Cost Comparison

2.F. Energy Savings Comparison
- LSoE: Levelised Savings of Energy (USD/TMF)

2.G. Energy Value Increase Comparison

- THE BUSINESS INTELLIGENCE MODEL
3.A. Energy Cash Cost 1
3.B. Cash Cost by department

3.C. LSoE (savings) by Mining Department
3.D. LVoE (value increase) by department
